Netdata: Turning Per-Second Observability, Edge ML, and MCP into a Diagnosable AI Observability Platform
# Netdata: Turning Per-Second Observability, Edge ML, and MCP into a Diagnosable AI Observability Platform
There are many monitoring tools. The hard part is answering three questions when an incident starts: where did it begin, how large is the blast radius, and what should we do next? A dashboard filled with centralized metrics usually answers only part of the first question.
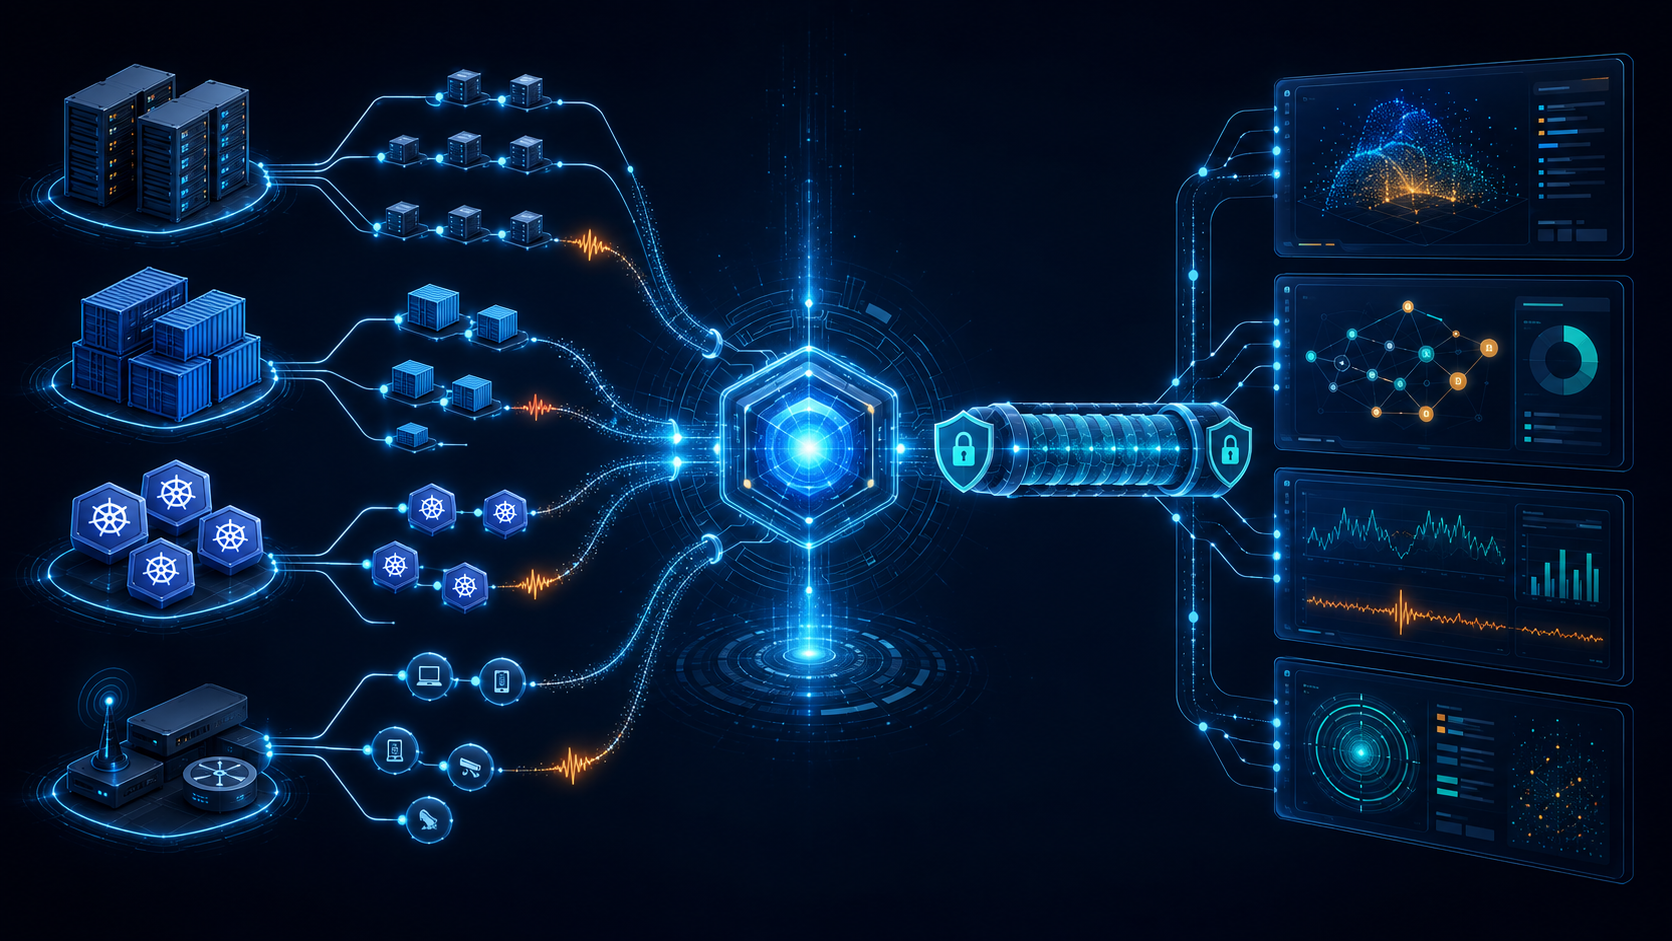
Netdata takes a different route. It places an Agent close to the data, continuously collects per-second signals, performs storage, anomaly detection, and alerting at the edge, then connects multiple machines through a Parent-Child architecture. In v2.11.0, the project also brings network flows, topology, application dependencies, and MCP troubleshooting into the same story.
This article does not treat Netdata as a tool for merely installing and viewing charts. Instead, it examines how Netdata turns high-resolution telemetry into an AI-assisted infrastructure troubleshooting workflow.
## The short version: Netdata is a data flow, not a chart collection
Netdata describes its Agent as an open-source, real-time infrastructure monitoring platform. Its core advantages are:
- **High resolution**: metrics are collected and displayed at per-second granularity, reducing blind spots in an incident timeline.
- **Edge processing**: collection, storage, ML, and alerting can happen where the Agent runs, without sending every raw signal to a centralized service first.
- **Automatic discovery**: built-in integrations create an initial view across system resources, containers, VMs, hardware, applications, and logs.
- **Distributed scaling**: one node can work by itself, while multiple Agents can use Parent-Child relationships to centralize dashboards, retention, and alerts.
Netdata is therefore not primarily for teams that want another attractive dashboard. It is for engineering environments that need to balance incident analysis, retention, and deployment cost.
## What does the Agent do at the edge?
It is more accurate to think of Netdata as a data plane close to the monitored system than as a dashboard. The project README describes the Agent pipeline as Collect, Store, Learn, Detect, Check, Stream, Archive, Query, and Score:
1. **Collect**: gather system, container, application, log, API, and synthetic-check data.
2. **Store**: retain metrics in a tiered time-series database.
3. **Learn**: build ML models for each metric from recent behavior.
4. **Detect**: identify anomalies without requiring a hand-written threshold for every curve.
5. **Check**: apply built-in or custom alert rules for explicit decisions.
6. **Stream**: send data to a Parent in real time, creating layered centralization and replication.
7. **Archive**: export data to Prometheus, InfluxDB, OpenTSDB, Graphite, and other systems when needed.
8. **Query and Score**: expose an API for queries and use a scoring engine to find cross-metric patterns and correlations.
The important design choice is that AI analysis does not have to wait for every signal to cross the network, land in another platform, and be processed by a later batch job. Many signals can be normalized and interpreted near their source, while the centralized layer preserves a cross-node view.
### Per-second data makes the timeline usable
Incident response often depends on a few dozen seconds: a short CPU spike, an exhausted connection pool, or latency changes immediately before a container restart can disappear after low-resolution aggregation. Netdata's tiered retention maps different zoom levels to different resolutions: recent data can stay at per-second granularity, while longer periods can use minute or hour resolution.
This is a practical compromise. You do not need to keep every signal at maximum resolution forever, but you can preserve the detail that matters in the time window where it matters most.
## From anomaly detection to MCP: AI helps answer why
A traditional alert tells you that a value crossed a threshold. It does not necessarily tell you why it crossed it now. Netdata's edge-based ML performs unsupervised anomaly detection from historical behavior, while the v2.11.0 release notes introduce Netdata Cloud AI Troubleshooting and MCP client capabilities.
The MCP positioning is important. Netdata Cloud can act as an MCP client and connect to GitHub, PagerDuty, Atlassian Cloud, or a custom MCP server to read external context during an investigation. This is the reverse of connecting Claude or Cursor to Netdata's own MCP server.
MCP is therefore not simply a chat window attached to a dashboard. It can place an alert timeline alongside changes, tickets, and incidents in one investigation context:
- The Agent detects that a metric has deviated from its usual behavior.
- Alerts and related metrics provide time, node, and impact context.
- The troubleshooting layer checks change records, PagerDuty incidents, or other tools.
- The engineer receives a contextual hypothesis instead of a curve that must be assembled manually.
Engineering judgment still matters. An anomaly score is not a root cause, and an AI suggestion is not change authorization. Netdata's value is reducing the distance between seeing an anomaly and forming a testable hypothesis.
## v2.11.0: observability moves beyond the host boundary
At the time of verification, Netdata's latest release was v2.11.0, published on August 12, 2026. The most important change is not one widget. It is the extension of infrastructure context into networks and dependencies.
### Network Monitor, flows, and topology
The official release notes label Network Monitor, Network Flows, Network Topology, and Application Dependency Mapping as Technical Preview. They are usable, but their interfaces, coverage, and support model are still evolving. A preview should not be treated as a completely stable product contract.
The direction includes:
- Network Flows receives NetFlow v5/v9, IPFIX, and sFlow, turning records into searchable, faceted views.
- An SNMP topology engine builds Layer 2 and Layer 3 network maps.
- The Linux Network Viewer shows communication relationships between processes, containers, and Kubernetes workloads.
- Query Engine improvements cover top-N queries, latest time grouping, cardinality limits, and tier-query correctness.
Together, these capabilities expand the troubleshooting question from "which host has an abnormal CPU value?" to "which workload changed its network interaction with which service?" For microservices, Kubernetes, and hybrid networks, that context is often closer to the root cause than a single host metric.
### Security must not be hidden behind the AI story
The same release lists MCP ACLs and bearer-token enforcement, reduced anonymous MCP metadata, a WebSocket decompression-bomb guard, an `ndsudo` privilege-escalation check, and hardening for installer arguments and configuration writes.
This is a reminder for adopters: once an observability platform reads GitHub, PagerDuty, or internal tools, it becomes a high-value data integration layer. Token scope, network boundaries, audit logs, and least privilege for MCP connections should be designed before an incident, not patched afterward.
## A five-minute trial: see one node's data first
A minimal experiment can start one Agent with Docker. Verify local collection and dashboard behavior before deciding whether to add a Parent or Cloud:
```bash
docker run -d --name=netdata \
--pid=host \
--network=host \
-v netdataconfig:/etc/netdata \
-v netdatalib:/var/lib/netdata \
-v netdatacache:/var/cache/netdata \
-v /etc/passwd:/host/etc/passwd:ro \
-v /etc/group:/host/etc/group:ro \
-v /proc:/host/proc:ro \
-v /sys:/host/sys:ro \
-v /etc/os-release:/host/etc/os-release:ro \
--restart unless-stopped \
netdata/netdata
curl http://127.0.0.1:19999/api/v3/info
```
The goal is not to call this production-ready from one command. It is to verify that the Agent starts, host metrics appear, and the local network and permission policy allow the required monitoring access. Production deployments should follow the official installation documentation and adjust volumes, capabilities, and networking for the platform's security policy.
To centralize data, evaluate Parent-Child streaming. To connect an existing metrics stack, evaluate Prometheus, InfluxDB, or Graphite export. Do not enable every capability at once; otherwise it becomes difficult to tell whether the issue is the data model, alert rules, or integration permissions.
## Three adoption traps
### 1. Treating preview features as stable APIs
The network monitoring, flow, topology, and dependency features in v2.11.0 are explicitly marked Technical Preview. They are useful for a proof of concept, but plans should allow for interface changes, coverage differences, and future packaging changes.
### 2. Watching anomaly scores without a testable runbook
ML reduces the burden of hand-tuned thresholds, but it cannot replace service-owner judgment. Important alerts should point to explicit checks: which dashboard to inspect, which deployment to compare, which dependency to confirm, and when rollback is appropriate.
### 3. Ignoring retention and permission boundaries
Per-second metrics, logs, long-term retention, and cross-node streaming all have costs. Define which data stays at the edge, which data moves to a Parent, which data may be exported, and who can read or trigger external MCP connections before choosing the architecture.
## Who should evaluate Netdata?
Netdata deserves a place in the evaluation list when a team:
- needs a finer incident timeline than traditional one-minute aggregation;
- wants local collection and anomaly analysis before choosing what to centralize;
- operates VMs, containers, Kubernetes, network devices, and several application types together;
- wants to move from alerts toward contextual troubleshooting without rebuilding the entire telemetry pipeline first.
If the requirement is only a minimal agent for an existing cloud monitoring service, or if every query, alert, and governance decision is already locked into another platform, Netdata's breadth may add more operational choices than value.
## Conclusion: the next step is shortening the reasoning chain
Netdata's engineering value is not the number of charts it provides. It is the way Collect, Store, Learn, Detect, Check, Stream, and Query form an edge-oriented pipeline, then connect network topology and MCP context back to troubleshooting.
For AI applications, useful observability is not simply giving a model more data. It means giving the data time resolution, node relationships, dependency context, and permission boundaries before it enters the reasoning loop. Netdata's current direction pushes a monitoring platform toward a diagnosable infrastructure system.
## Sources
- GitHub repository:
- GitHub repository metadata:
- README:
- v2.11.0 release notes:
- Distributed observability pipeline:
- Netdata AI and troubleshooting documentation:
- Verification time: 2026-08-31 UTC. GitHub API reported 80,379 stars and a last push on 2026-08-31, satisfying the requirements of more than 5,000 stars and an update within 180 days.